Corporate Money Dominates Oregon Lobbying
Tuesday, February 12, 2013
The Sockeye
Corporations and business groups account for 56% of all lobbying in 2011-12
The 2013 legislative session is in full swing, which means the capitol is buzzing with lobbyists, legislators, and advocates of all stripes. If you want to know who’s going above and beyond to try to influence Oregon lawmakers, follow the money.
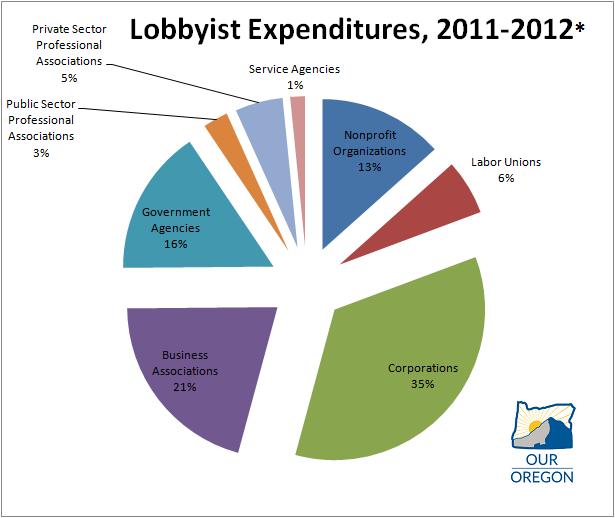
Lobbyist expenditures (2011-2012) Over the last two years, corporations and business groups have spent more than $28 million lobbying the Oregon legislature, accounting for a combined 56% of all lobbying expenses in 2011 and 2012.*
If you add the lobbying efforts of private sector professional associations (which lobby for the interests of a specific profession), business interests accounted for more than 60% of all lobbying.
The high-priced lobbying by corporate interests far outstripped any other lobbying category, according to our analysis of public records compiled by the Oregon Government Ethics Commission.
For example, corporations and business associations spent nearly 10 times ($28.1 million) what labor unions spent ($3 million) over the two-year period.
Corporations: $17,630,639 (35% of all lobbying)
Business Associations: $10,442,511 (21% of all lobbying)
Government Agencies (schools, agencies, tribes, utility commissions, etc.) and their associations: $7,935,848 (16% of all lobbying)
Nonprofit Organizations: $6,761,529 (13% of all lobbying)
Labor Unions: $3,000,162 (6% of all lobbying)
Private Sector Professional Associations: $2,594,530 (5% of all lobbying)
Public Sector Professional Associations: $1,361,619 (3% of all lobbying)
Service Agencies: $804,651 (1% of all lobbying)
Combined, lobbyists spent more than $50,531,490 in 2011 and 2012.
These reports covered the full 2011 legislative session and the one-month session in February 2012. Two years ago, we did a similar analysis on the 2009-2010 sessions and found many of the same results—what’s changed is that corporate interests now account for an even larger percentage of all lobbying.
The Takeaway: Corporations and business associations spent more on lobbying than all other groups (labor unions, nonprofits, schools, etc.)… combined.